Jenkins Automation Testing: Concepts and Tools
A complete guide on Jenkins Automation Testing. Checkout the 8 most popular continuous integration tools used in Jenkins automation testing.
Jenkins, just like any other Continuous Integration (CI) tools, is used in the process of Jenkins automation testing during software development. That prevents and alerts any integration issues after a code commits or merges, and can automatically trigger automated unit and functional application tests.
To ensure that nothing goes wrong in an agile team, constant code integrations are common during the day, making it even more necessary to use these tools. Jenkins is the most popular continuous integration (CI) tool and consequently, there are several plugins and features available.
We will talk about some of them, that we use in the process of Jenkins setup, Jenkins documentation, Jenkins architecture, Jenkins image and QA.
8 CI Several Plugins and Features
Following are the top CI plugins and features :
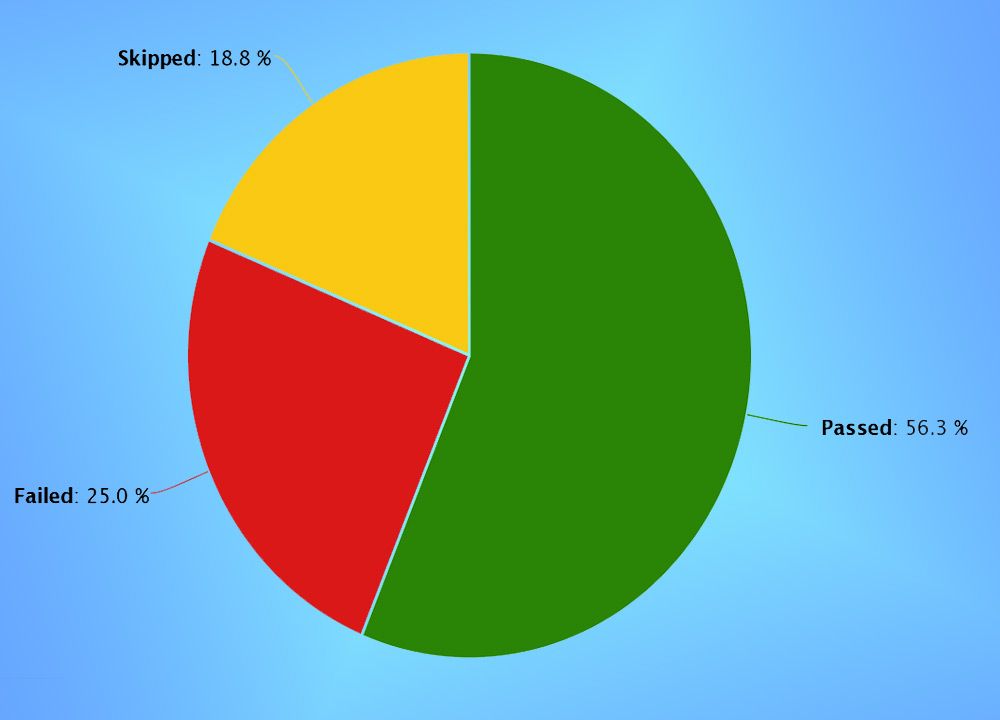
1. Test Result Trend (JUnit Plugin)
The JUnit plugin presents a simple but very useful graph of the trend of automated tests, based on the latest job executions. As it appears right when we access the job at Jenkins, we can get quick feedback on the number of tests run, passed, or failed. When a very drastic change occurs in the chart, then it’s a good indication that something is changing in the environment in which automation tests are running.
Discover how the Mockito framework can simplify unit testing by allowing you to create mock objects and define their behavior with ease.
Requirements:
JUnit, TestNG, or any technology that generates files in JUnit XML format.
How to set up:
- Go to Job Settings > Post-build actions > Publish JUnit test report.
- Add the path of the .xml files generated by JUnit after the tests run. If you use Maven, the files will generate the “surefire-reports” folder.
- Sometimes run the job to generate the chart.
2. Test Results Analyzer
This plugin presents in a consolidated way the results of all tests in all builds of a job. It is present in a table format. Wherein the row is the test scenarios, and in the column are the builds, showing the result: PASS, FAILED, SKIP, etc. This is one of the main plugins we use to analyze the cause of the failures.

With it, we can easily understand when a test is unstable (times passing, sometimes failing) or if it has begun to fail constantly and the exact date on which this began to happen. Without this, we would need to access build manually to verify this information, wasting our time a lot.
Requirements:
JUnit, TestNG, or any technology that generates files in JUnit XML format.
How to configure:
Same as explained in the previous topic: JUnit Plugin.
3. Archive the Artifacts
The artifact archiving function is a native Jenkins feature that allows you to build any artifact that generates during its execution. In an automated testing job, you can use this feature, for example, to save test evidence, screen screenshot, automation-generated reports, or system-exported files, making it available for consultation at any time.
Setting it up
- Go to Job Settings > Post-build actions > Archive artifacts.
- Add the path of the files you want to archive.
4. Automatic Trigger Build
This is also a native Jenkins feature, which allows you to schedule the execution of a job for any time of the day repeatedly. You can schedule to run a full test suite at an alternate time (for example, at 11:00 pm). So when you arrive in the morning, just access the job and analyze the test result.
Setting it up
- Go to Job Settings > Trigger builds.
- You can set the job to run from Monday to Friday (1–5) always at 7 and 19 o’clock (0 7, 19).
5. Cucumber Living Documentation
For you, who writes the tests with Cucumber, a cool plugin is Living Documentation. When configured in the job, this plugin generates complete PDF and HTML documentation based on your User Stories. This documentation includes which features, scenarios, and steps passed and which failed, in addition to the time automation, took to test each step.
This documentation is generated in real-time, that is, right after the automated test job runs, the documentation is updated with the test result and is available in a URL in Jenkins. Your team, stakeholders, PO can use this document as a system specification.
Requirements:
Cucumber
How to configure:
- You must first configure Cucumber to generate a JSON file.
- Go to Job Settings > Post-build actions > Living documentation.
- Add the path where the JSON is generated.
6. Build Failure Analyzer
As we increase coverage of automated tests in our system, we should also take greater care so that nothing gets out of control, as we will have a lot of tests to keep running and analyze the flaws that may appear.
To facilitate the analysis of these failures, we can use the Failure Cause Manager plugin, which allows us to record in Jenkins the causes in which a job or test failed. This is useful when two or more people are analyzing failures at the same time.
To register the failure, the plugin offers a screen where we must inform some text that identifies the failure in the console output. This is the screen:
Setting it up
- Accessing any Job, go to Cause Failure Management.
- Click Create new.
- Fill in the fault information. At this point, it is important to fill in the “Build Log Indication” field, as it is who will identify whether the build failed.
- That’s it. Any build in which the failure occurs will be identified.
7. Cucumber Reports
This plugin presents cucumber’s test results in an HTML report accessible by Jenkins himself. The information is grouped by tabs: “Feature”, “Tags”, “Steps”, “Trends” and “Failures”.

How to configure:
- Configure Cucumber to generate a JSON file, as explained earlier.
- Go to Job Settings > Post-build actions > Cucumber reports.
- Run some tests so that the information is generated and the report made available.
8. Jenkins API
Imagine that your customer or manager comes to you and says, “I need to know how many tests you’ve run this year, how many times each test you’ve run, and what the results have been (Passed/Failed).”
Then you remember that you have more than 500 automated tests that run every day on different systems. The collection of this information manually would be unfeasible. The solution was to collect this information through the Jenkins Rest API.
Through the API, we can collect information about any job, build, test result, artifacts, duration, etc., allowing you to filter the information that interests us most. The available formats are JSON, XML, and a specific python format. When you add an “/API” to the Jenkins URL, a screen will appear as below, with information about the API: Not all URLs have this feature. On this screen in the image above.
In conclusion, these are some Jenkins features and plugins that will help you in testing automation activities. We hope we have helped! If you still have any questions related to Jenkins automation testing Jenkins setup, Jenkins documentation, Jenkins architecture or Jenkins image, feel free to refer to them in the comments below. We will try to answer them for you.
Related Articles
Ready to put this into practice?
Appsierra's expert-supervised QA and AI engineering pods help teams ship higher-quality software faster — with senior accountability and a low-risk pilot. Tell us what you're working on.