11 Test Automation Metrics and their Pros & Cons
An insight into Test Automation Metric that you should know about. A list of the test automation metrics along with their pros and cons.
In the entire process of software development, test automation is considered essential because of its capabilities of defining software quality more efficiently. In this fast-changing agile environment, test automation metrics prove to be a very large investment in the technology sector.
In case automation testing metrics are not carried out, our entire investment might go in vain. These automation metrics are responsible for undermining the parts of test automation that are working and the ones that need to be repaired.
One thing that makes the installation of automation metrics a boon is that their deployment on a project simplifies the software testing process. It also delivers web product into production as early as possible and saves financial resources for the client.
Several tests could be performed in a short period which would improve the software functionality. Though these automation processes are not an alternative to manual testing. This is so because it needs more concentration and effective tools to perform the testing smoothly. Only then an appropriate quality web product could be ensured to the end-user.
The test automation metrics also keeps a check on whether the organization is doing the right thing going in this direction and getting benefited out of this. After a brief description of how test automation metrics are beneficial, let’s get an insight into 11 Test Automation Metrics.
What are Test Automation Metrics
Here is the quick list of 11 best test automation metrics:
1. Entire Test Duration
Definition: This automation metric means the total time taken from the start to the end to run an automated test.
Pros: The test time assessment is a fundamental part of the testing as it characterizes the attempts that should be performed by a test team and assets that should be committed. This metric is the backbone of the agile development cycle. This is so because in case the tests won’t run, the teams won’t function at all.
Cons: Indeed, even the most deliberately followed time of testing doesn’t show the product quality. This happens so because only the period is shown there. That’s why it could not be considered a worthy measurement automation factor.
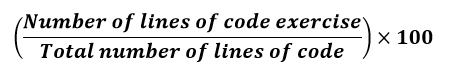
2. Unit Test Coverage
Definition: This metric means the number of unit tests conducted to examine if the whole code is covered.

Pros: Unit test coverage gives a clear picture of how good the codebase of the software is. This rough approximation helps in making the metric a good measurement automation factor.
Cons: Unit tests are a trial of a single unit. For example, All the units in a vehicle may work fluently, yet that doesn’t ensure that the vehicle will start. In programming as well, integration tests are vital to guarantee that the programming is functional, and unit test inclusion doesn’t take those examinations into account.
Moreover, this automation metric measures in most development languages just the code that is transferred into the memory. An important part of the code isn’t stacked to the memory and along these lines, it isn’t assessed. That’s why the 100% probably won’t address the genuine code base.
3. Number of Defects
Definition: This test automation metric calculates the number of defects faced during the test execution phase.
Pros: The quantity of defects discovered is a basic proportion of “how bad” a product is contrasted with past deliveries. These defects discovered are valuable for predictive modelling, in which you can gauge the residual defects expected within certain levels.
This permits us to compare tried products and past deliveries and further change its quality. There is a predictable change that characterizes what defects can be found under specific conditions.
Cons: This is an exceptionally deceptive test automation metric, which can be effortlessly controlled. A higher number of bugs may be an aftereffect of more thorough testing, yet it could also mean the inverse. For example, a testing group compensated by this measurement may be headed to find numerous defects that don’t have significant importance.
On account of exact testing, this automation metric may discover bugs that are not vital and have very little effect on functionality. The metric might be misleading and show non-fundamental issues that stand out for testers from the testing scope.
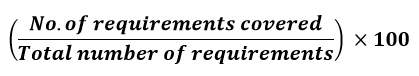
4. Coverage of Requirements
Definition: This automation test metric describes the features that are tested, and the ones that are aligned with some requirement or user story.
Pros: The significance of this test measurement metric is to follow the number of features that are satisfied by the clients’ requirements and if they are considered by tests. It tells about the conditions of each test that is under testing.
Cons: Test, which analyzes just a single necessity, can check just specific components. That’s why the estimation of such a test isn’t high and proves to be a disadvantage of automation testing.
5. Coverage of Path
Definition: The path coverage metric is a measurement of the linearly independent paths covered by the tests.
Pros: Path coverage requires extremely exhaustive testing that improves the nature of the testing cycle. Each iteration in the program executes for once with full path inclusion. Here point by point testing is required to build the nature of tests. Each program explanation is executed once in full path coverage.
Cons: The amount of path increments exponentially with the number of branches. Therefore adding one more explanation to a function with 11 statements changes the number of potential ways from 2048 to 4096. The more the branches are, the greater is the variety of ways. Alteration of one “if” to the statement can increase the number path to twice.
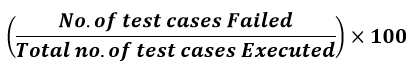
6. Percentage of Passed or Failed Tests
Definition: This automation metric tells the total number of passed and failed tests, as a percentage of entire tests that are running.
Pros: Counting the failed or passed tests gives an outline of testing progress. A visual chart could be made that shows passed tests, failed tests, and tests that haven’t been run at this point. You can analyze figures across various deliveries and various days.
This offers a chance to monitor the testing progress. It permits comparing the advancement of each testing circle by making the tests with passed, failed, and unperformed tests to know the pattern of testing and anticipate the result.
Cons: Summing up experiments passed doesn’t assure about the nature of these tests. For example, a test may pass since it checks an insignificant condition, or due to a mistake in the test code, while the actual product isn’t working as wanted. Also, this measurement automation metric doesn’t mention to us which level of the product is covered by tests.
Basic checking of conducted tests can’t give data about the items’ quality. Regardless of whether the per cent is precise and each test is thought of, this can’t be the guarantee that the nature of the product is growing, and for QA it is somewhat a significant point.
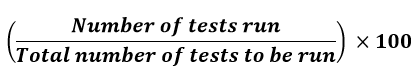
7. Test Execution
Definition: It is the most common test automation metric displayed by test automation tools. It shows total tests executed being a part of a build.
Pros: Test execution is an essential automation metric used to comprehend whenever automated tests run true to form and total their outcome.
Cons: Since tests can have false positives and false negatives, the way that tests run, or that a specific rate passed, doesn’t ensure quality delivery. As in the case of different automation metrics, a detailed rate isn’t sufficient to ensure quality delivery. Data about execution can show the number of tests was productive, yet the immediate dependence of the outcome on it isn’t high.
8. Irrelevant and Useful Results
Definition: This is a test automation metric that analyzes important outcomes from automated tests against insignificant outcomes. The differentiation between valuable and irrelevant outcomes is as per the following:
- Useful results: Either the testing fails or passes, but the test failure should be brought through a defect.
- Irrelevant Results: Test failure coming about because of changes to the product or issues with the testing environment.
Pros: Irrelevant outcomes feature factors that lessen the productivity of automation from an economic outlook. It is easy to compare an irrelevant outcome and a valuable outcome concerning a described adequate level. At the point when the pace of irrelevant outcomes is excessively high, you can research and improve comprehension of what has turned out badly, to improve automation testing.
Cons: This test automation metric doesn’t show us software quality. It is only useful in understanding issues in the actual tests.
9. Production Defects
Definition: This metric plays out the primary undertaking of testing. It defines the quantity of identified bugs.
Pros: Such an automation metric permits us to follow the risen issues and change testing with the expansion of new measurement automation tests to get comparative issues later on.
Cons: Some of the discovered issues may not be the defects that influence the quality on a genuine level. It is smarter to distinguish defects prior, than in the production stage. They should be found in the improvement circle.
Numerous significant issues don’t show themselves as defects underway. Also, it is unfortunate for defects to initiate at all. This metric is a “final resort”, however, teams should plan to find defects a lot sooner in their development cycle.
10. Broken Builds Percentage
Definition: Automation tests can fail flat and “break” the build. This test automation metric shows the wrecked builds brought about by failed tests and codebase quality.
Pros: This metric shows the real code quality, and if the per cent of broken builds is going, it implies that experts demonstrate more dependable towards changes in the codebase. The level of broken builds is regularly taken as a sign of sound designing practices and code quality. A diminishing level of broken builds shows engineers are assuming greater liability for the precision and security of their code.
Cons: Excessive attention for this information may cause an irregular selection of issues and their fixing focusing on the identified broken builds rather than the presentation of focused on test tasks and their principle direction.
11. Automated Test Coverage
Definition: The quantity of executed automation tests is shown in rate, compared, and absolute test coverage.
Pros: Like most of the measurement automation metrics, this one shows the testing progress and the viability of the automation machine.
Cons: Automation can’t reveal all the issues sometimes, which manual tests can show. That’s why it is declared as one of the disadvantages of automation testing.
Conclusion
The referenced examples of test automation metrics are essential to characterize the reasonability of testing methods. They provide testers with an away from conducted tests and their effect on product discharge. To perform appropriate monitoring, it is pertinent to apply the correct metric for the correct test.
Related Articles
Ready to put this into practice?
Appsierra's expert-supervised QA and AI engineering pods help teams ship higher-quality software faster — with senior accountability and a low-risk pilot. Tell us what you're working on.