
AI Agents, MLOps to QA Pipelines: Top 1% Tech Talent in 3 Days
Facing talent gaps or software glitches? Our proprietary AI platforms, Pitch N Hire and OnJob.io, deliver pre-vetted AI Engineers, Cloud developers and QA experts in 72 hours, speeding up launches and ensuring flawless quality. Trusted by Startups, Fortune 500s and AI Innovators.


1,251+
Projects Delivered
72-Hours
Time to Deploy talent
60%
Cost Savings


Our Products
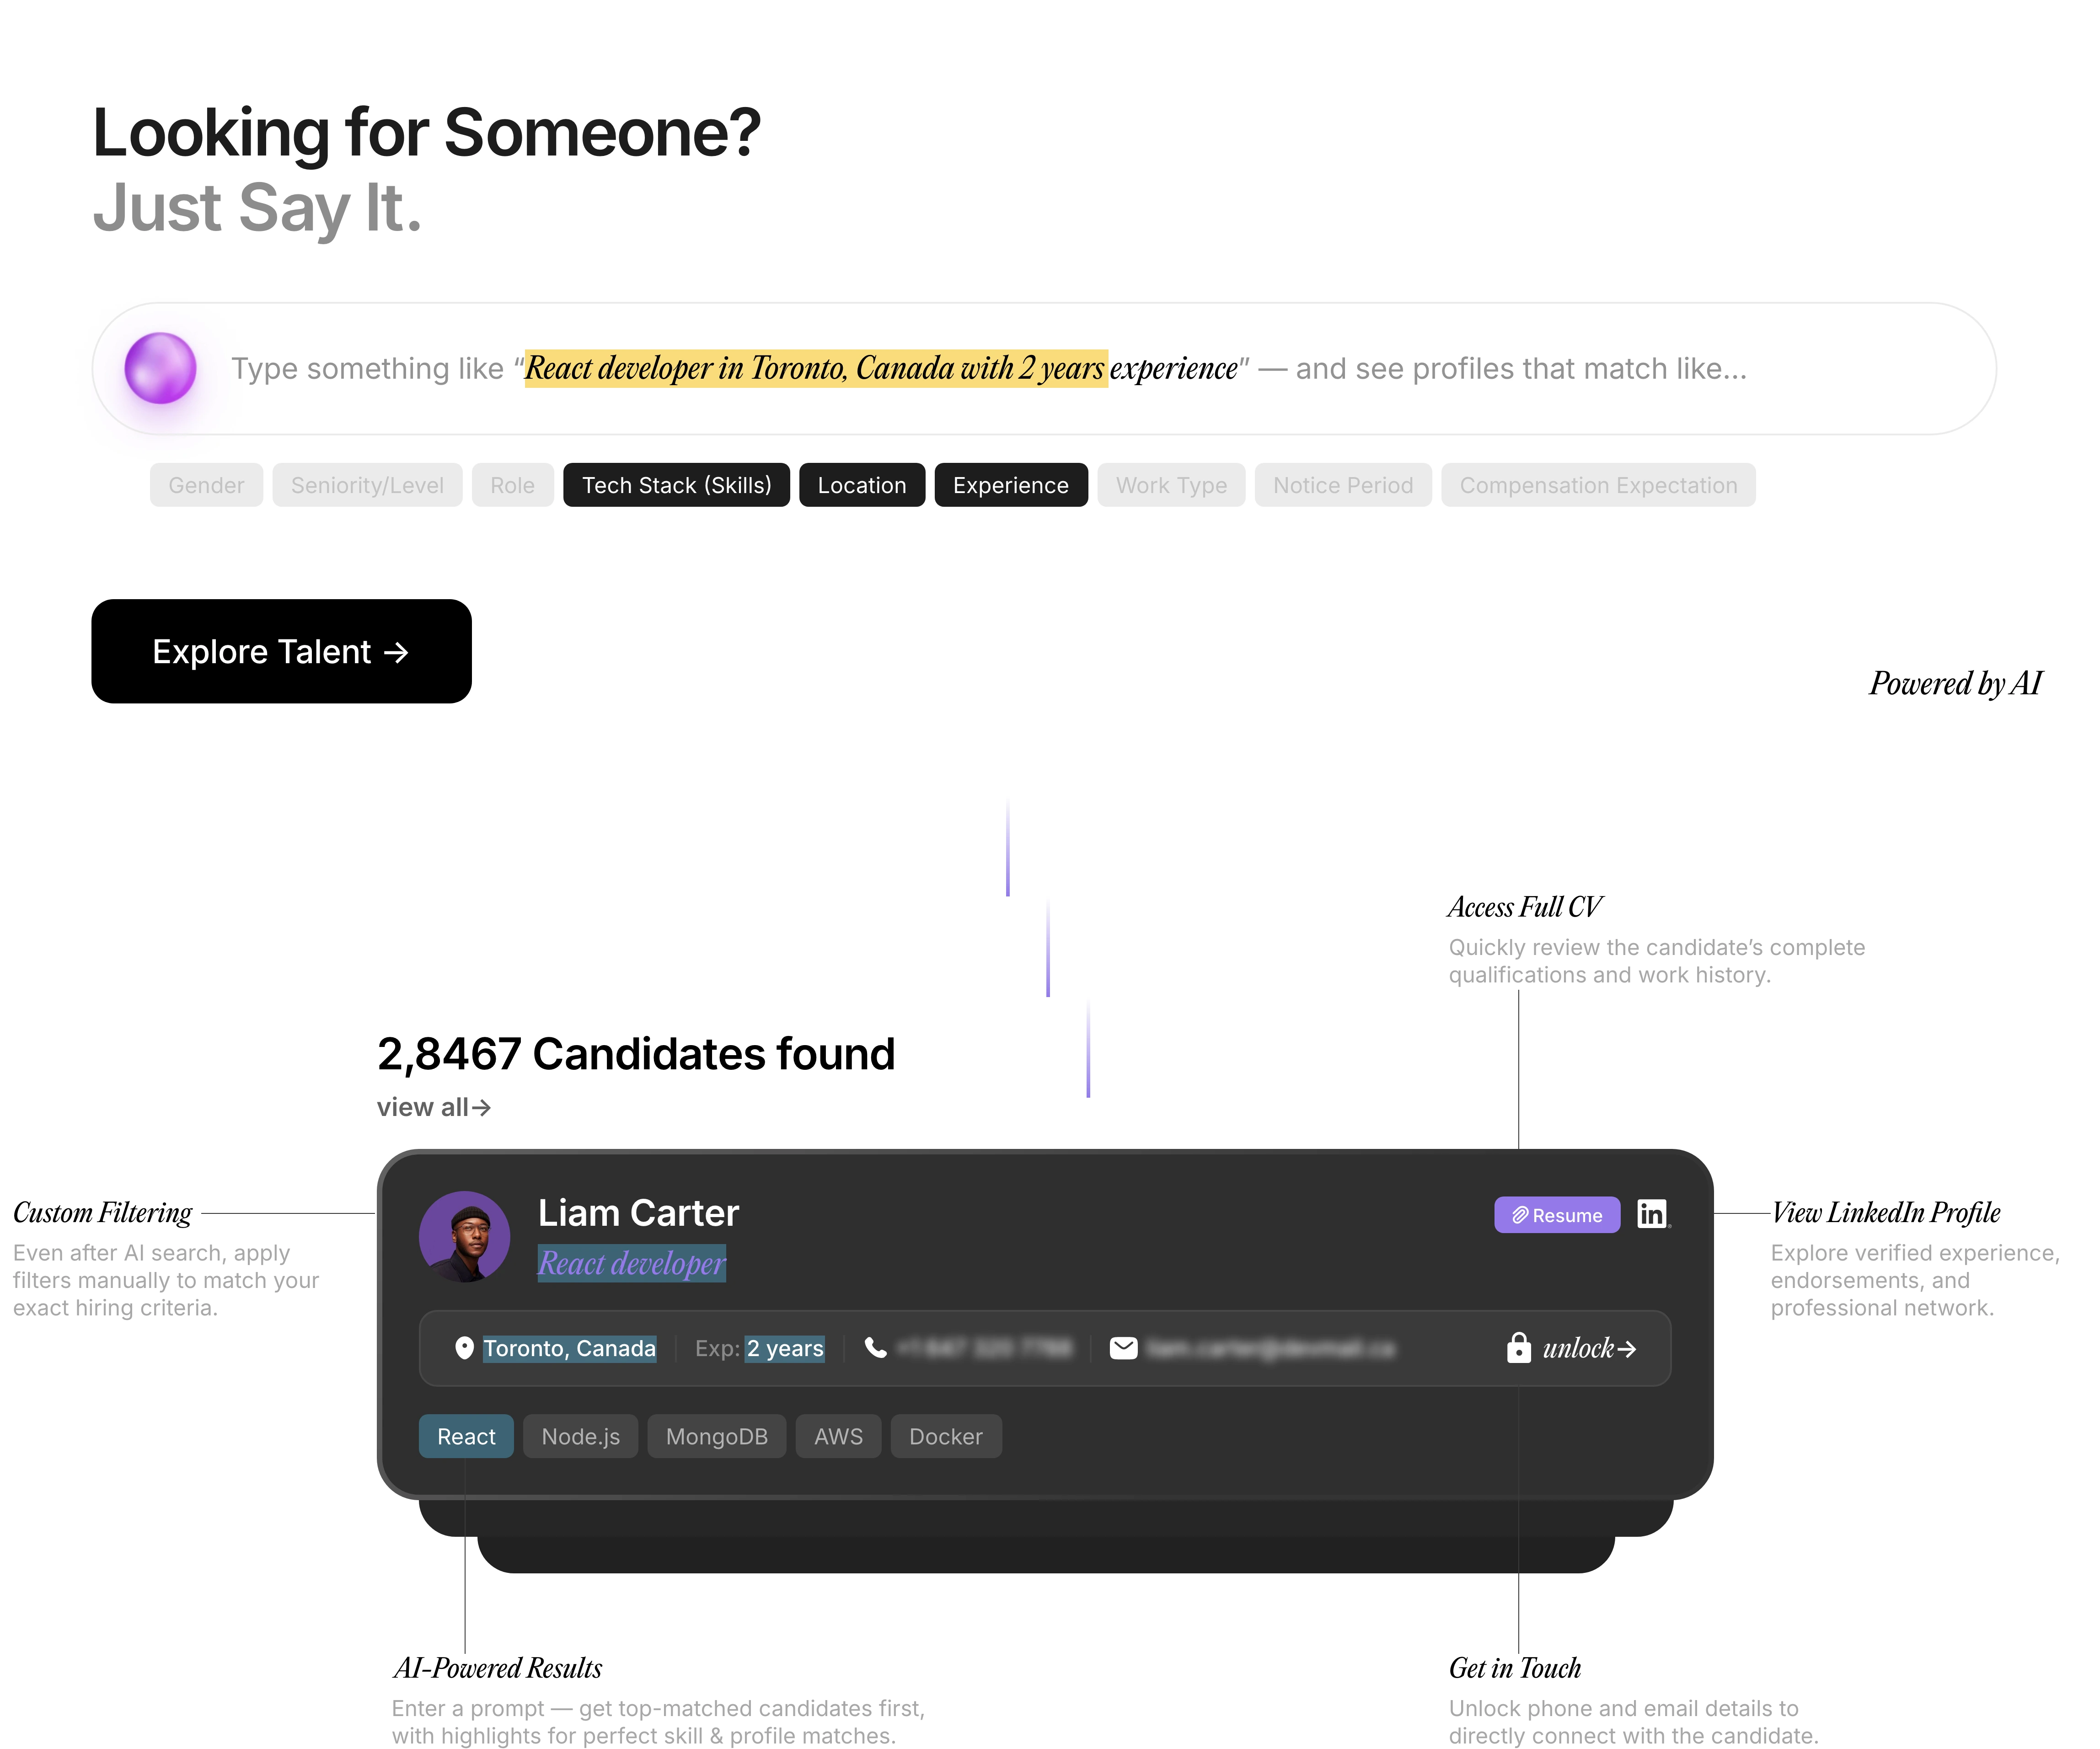
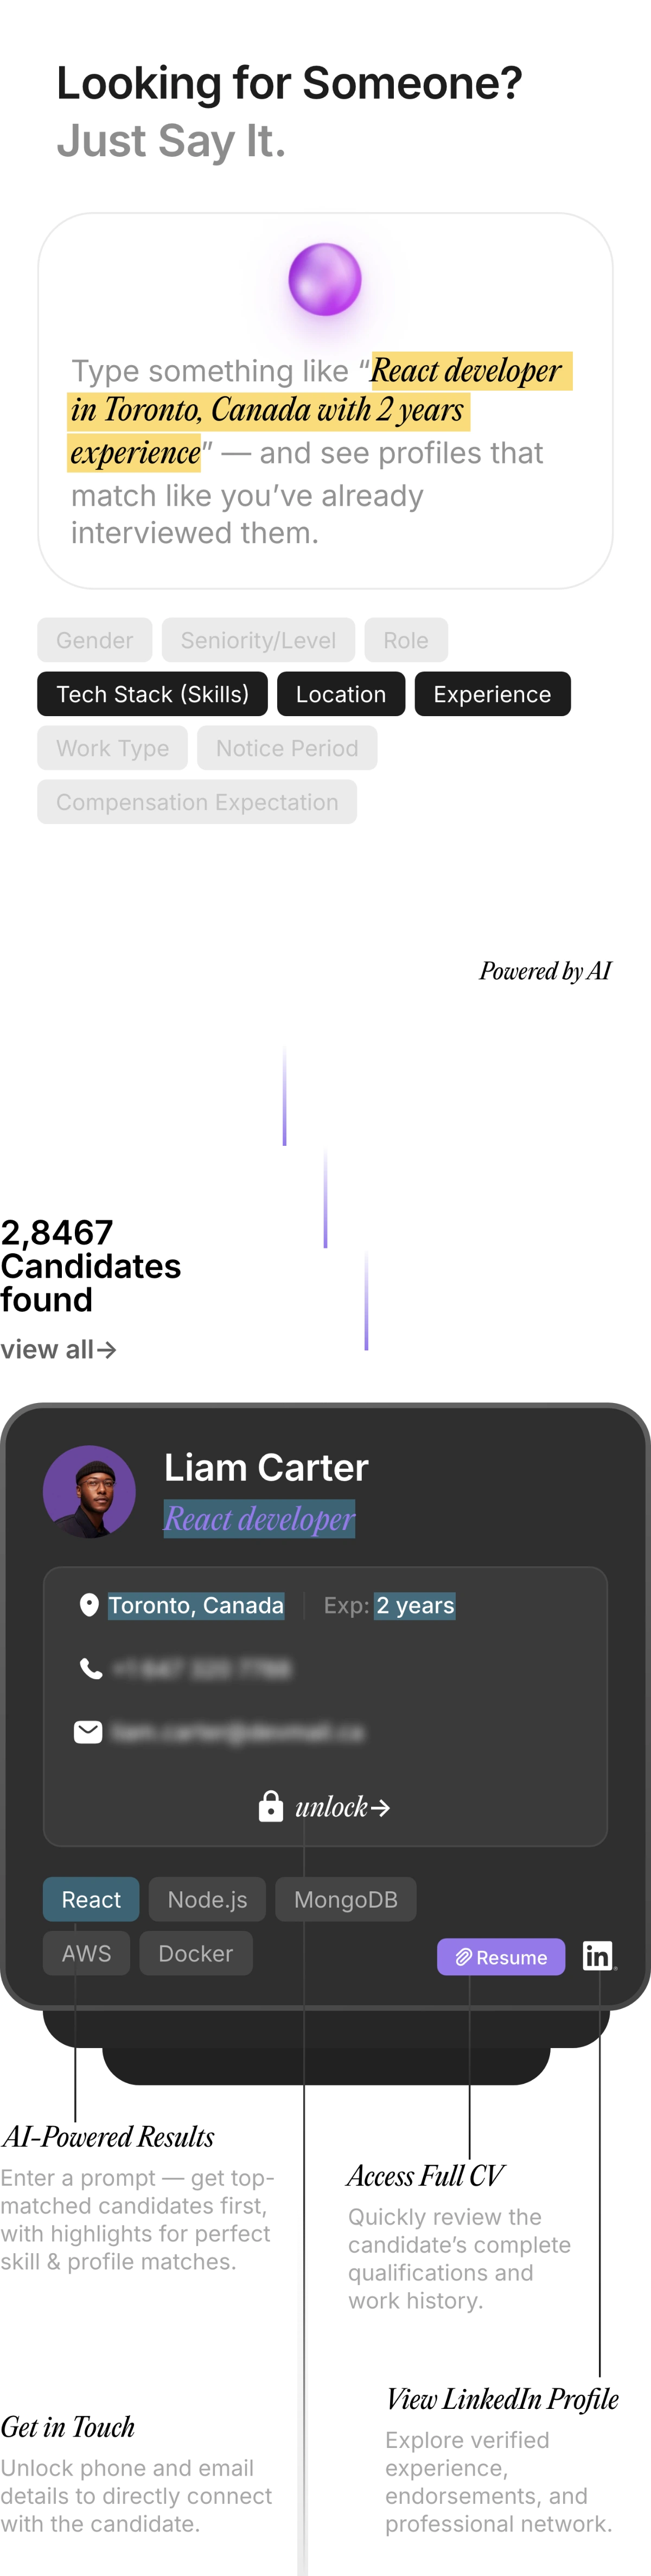
Redefining Talent Acquisition with Our Next-Gen AI Products
Pitch N Hire and OnJob.io are revolutionizing how modern companies hire — sourcing, evaluating, and onboarding top-tier talent 70% faster than traditional methods. Built to deliver job-ready, culturally aligned professionals , our platforms ensure precision, speed, and hiring confidence — at scale.

Built for the AI Era. Engineered for the Future.
At AppSierra, we’re not just building software — we’re building intelligent systems that think, scale, and adapt.
From powering Fortune 500s to helping startups accelerate growth, our team of elite engineers, QA architects, and DevSecOps experts deliver precision-driven, future-ready solutions.
Whether it’s automating QA pipelines, deploying AI-powered hiring platforms, or driving product engineering at scale — we help businesses build smarter and launch faster.
AI-First Approach
Every process we build is optimized for intelligence and efficiency.
Global Engineering Talent
Vetted teams that scale with your vision.
Zero-Defect Delivery
Shift-less testing + automation = flawless releases
Rapid Delivery Models
Get startes in as little as 72 hours.
AI & ML Experts
Develop intelligent copilots, predictive models, and automation with GenAI, NLP, LangChain, RAG, OpenAI, and Microsoft Copilot for enhanced productivity.
QA Automation & SDET
Ensure flawless releases with Selenium, Cypress, Playwright, and CI/CD integration.
Cloud & DevOps Professionals
Deploy on AWS, Azure, GCP, Kubernetes, and Terraform with DevSecOps expertise.
Blockchain Specialists
Build secure DApps, smart contracts, and transparent systems using Ethereum, Solidity, Hyperledger, and Chainlink for decentralized innovation.
Edge AI & Embedded Systems
Power real-time IoT and 5G solutions with Jetson, TensorRT, YOLOv8, and AWS IoT Core for connected devices/
Transform data into insights with Tableau, Power BI, Python, and Looker for real-time business intelligence.
Data Analytics Leaders
Testimonials
What Our Clients Say About Scaling with AppSierra
4.8/5
Delivered 300+ successful projects driving innovation for startups, enterprises, and global SaaS brands.


Trusted by 60+ global brands & growing.

Santosh Bheemarajaiah
VP of Engineering, Rocketium

AppSierra’s QA engineer quickly helped us detect critical bugs. Their daily updates and monthly reports make them a dependable, long-term partner.
Rajiv Dhananjayan
Senior Delivery Director HCL Tech
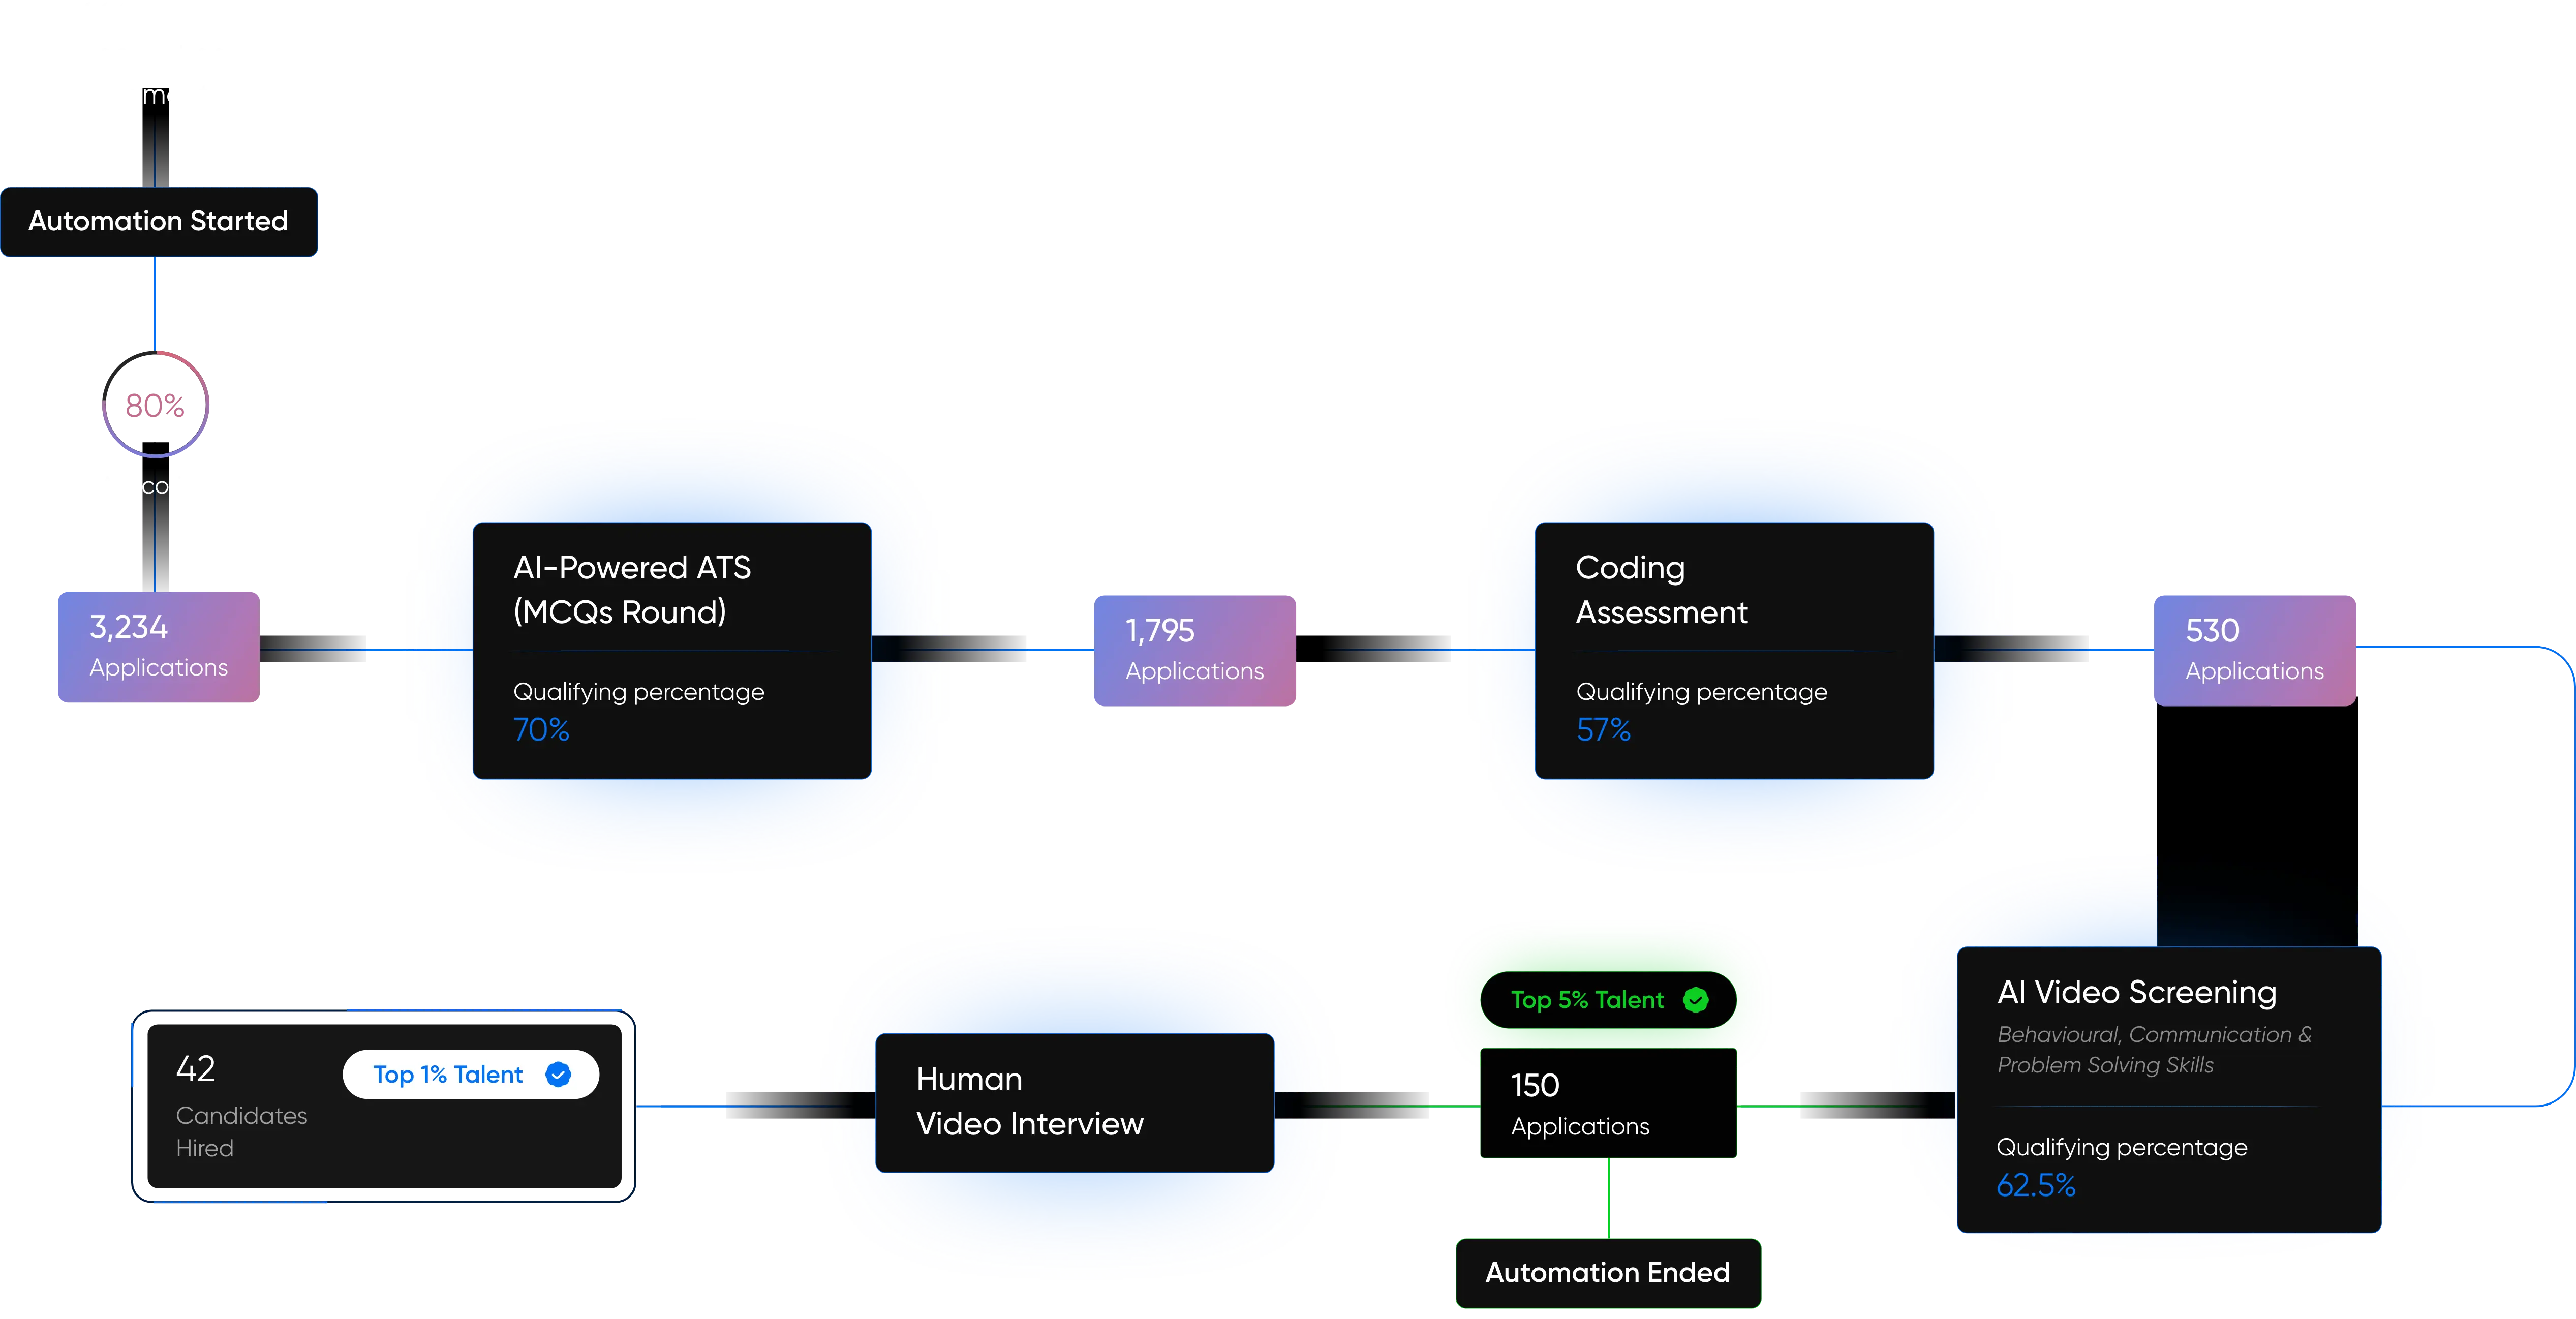
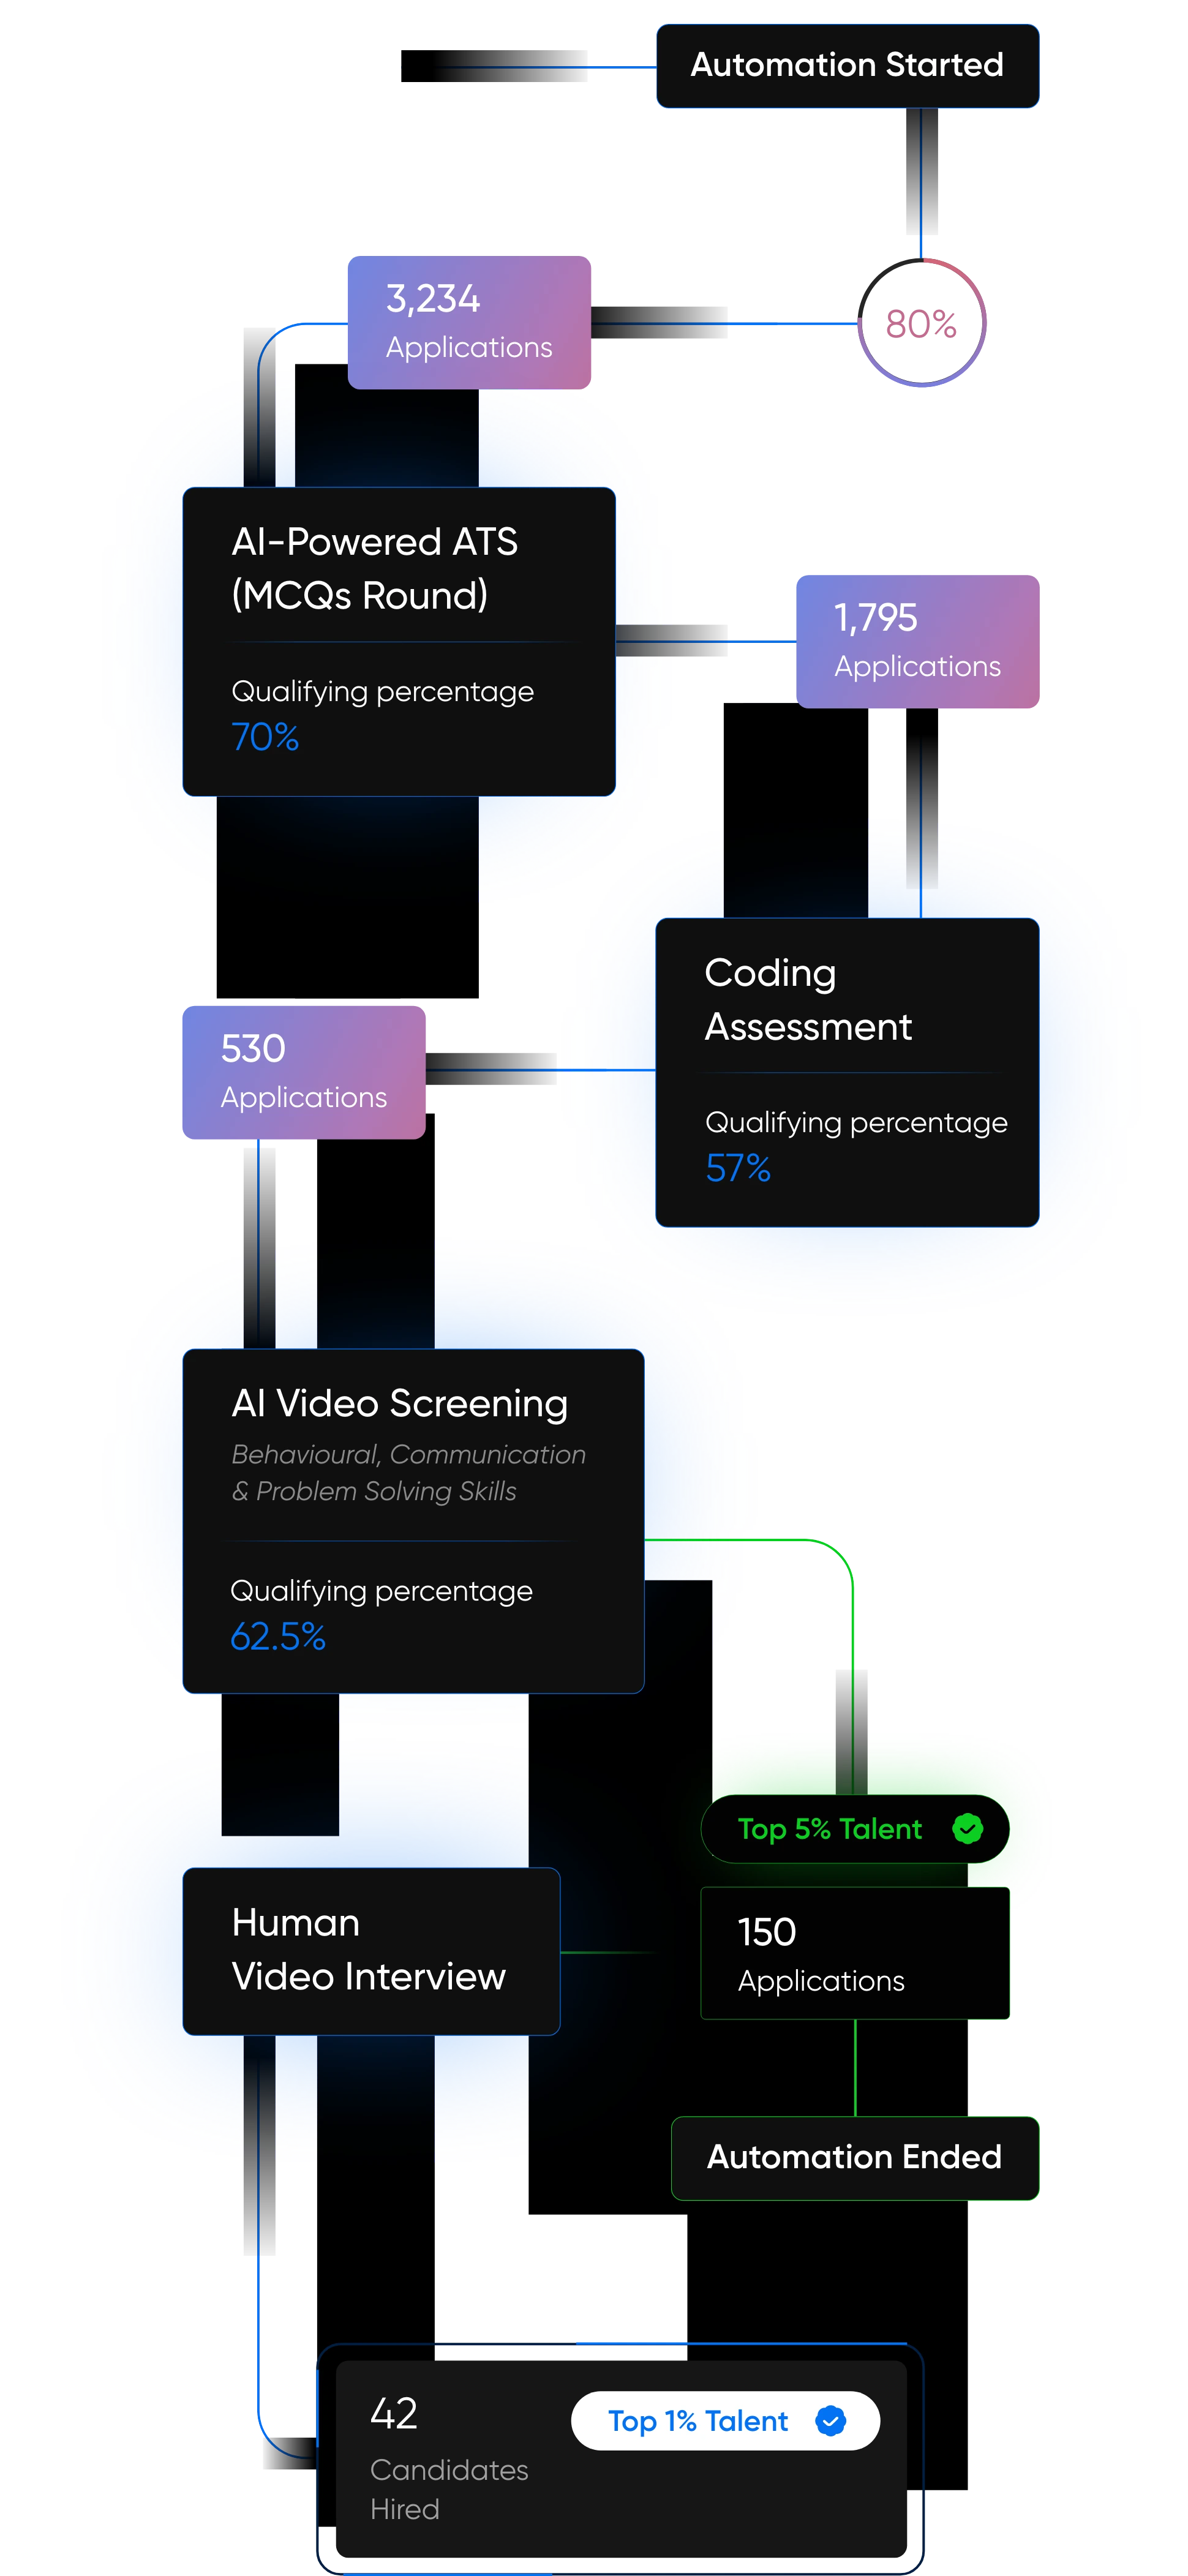
AI-Driven Hiring
Pitch N Hire and Onjob.io helps vet top 1% talent with 95% match accuracy.

End-to-End QA
Shift-left testing, automation, and DevSecOps for zero-defect software.

Maximize ROI
Reduce defects by 58% and hiring costs by 30% with AI-driven precision.

Scale with Confidence
Flexibly scale teams from 1 to 100+ engineers, aligned to your goals.

72-Hour Delivery
From request to deployment, we’re faster than any competitor.
Enterprise-Grade Security
From DevSecOps to compliance-ready processes, we embed security at every stage of your product lifecycle.
Success stories
Transformations That Speak for Themselves
Fintech Acceleration
Partnering with a forward-thinking fintech brand, AppSierra introduced a secure, scalable system that transformed operations, minimized fraud, and elevated customer acquisition.
35%
Reduced transaction processing times significantly.
30%
Strengthened security protocols, lowering fraud incidents.
20%
Boosted customer acquisition through improved performance.
BFSI Excellence
With a major BFSI player, we implemented a digital banking solution that reduced operational load, saved millions, and enhanced customer satisfaction.
30%
Reduction in manual processes.
$8M
Annual savings in operational costs.
15%
Boosted customer acquisition through improved performance.
HealthTech Overhaul
AppSierra partnered with a healthcare leader to build a robust Health Information System (HIS), streamlining data access, reducing costs, and improving patient engagement.
40%
Faster patient record access.
$6M
Annual cost reduction.
25%
Rise in patient satisfaction scores.
Let’s Build the Future of Tech, Together
From elite QA and engineering to AI-powered hiring,AppSierra helps fast-growing teams scale smarter and ship faster.

Services
Industries
Technology CoE
Products
Powered by
Appsierra Group


Copyright© (2025 - 2026). All Rights Reserved

Privacy Policy